Hello everyone,
This blog is part of my learning and analysis of various Business Intelligence tools based on 5 different criteria I selected. I hope you all enjoy reading this blog as I share my knowledge based on my findings.
This blog is part of my learning and analysis of various Business Intelligence tools based on 5 different criteria I selected. I hope you all enjoy reading this blog as I share my knowledge based on my findings.
BUSINESS INTELLIGENCE TOOLS ANALYSIS
TABLEAU
Strengths:
- Intuitive visual insights allow for interaction with business data in an easier way. Convenient to use even for a novice with no technical background.
- Excellent dashboard capabilities
- High quality support by quick resolution of problems
- Effective data integration from various sources e.g. SQL Server, Oracle, Excel and others
- A large number of features provided at low cost
Weaknesses:
- Not a good tool if you want to perform custom modifications or use 3rd part plug-ins
- Does not have a very robust security system
- No support for features that perform predictive and extended analytics
- QLIK
Strengths:
- Great visualizations of data as part of the User Interface
- Smart tool that can easily handle complex ETL
- Has an exceptional capability for data discovery. Allows users to dive deep down into the data for analysis
- Provides the fastest implementation time and excellent performace in crucial BI projects
- Overall product quality is great and it also provides for strong vendor and implementation support
Weaknesses:
- The tool deals with a lot of scalability issues
- It is an expensive tool to operate with. For example, A Qlikview server deployment can get very expensive. Per user costs and licensing and support cots are also pretty high.
- It is better suited for a developer or an analyst than a non-technical user. There are a few tasks for which technical knowledge is required. For example, coding of a script.
- Not a very useful tool for real-time reporting as the report/data needs to be fetched from the underlying databases from time to time.
TIBCO
Strengths:
- In-memory BI platform enables highly scalable and rapid visualizations
- Strong predictive and advanced analytics capabilities help businesses examine data with a lot of new perspectives
- Extensive feature set because of integration of expert capabilities through acquisitions
- Excellent in geo-based analytics and hence, can look towards improving sales and marketing practices based on location
Weaknesses:
- Requires some amount of technical knowledge for the users to be able to work with it
- Limited functionality to personalize visualizations
- Few features such as combination charts, statistical tables, etc. are not very flexible or easy to format
PENTAHO
Strengths:
- Stresses a lot on user experience. Easy to use tool with visually attractive data analysis
- Enables easy access and integration of data from disparate sources
- Very good performance because of in-memory caching techniques
- Seamlessly integrates with third-party applications and supports every platform – iPhone, Android, Windows, etc.
Weaknesses:
- Visualizations and advanced analytics not as good as Tableau and Spotfire respectively
- Poor support capabilities. A new license needs to be purchased every year, at the same price
- Difficult to understand the metadata layer especially with minimal documentation available
- BIRST
Strengths:
- The tool has some interesting visualizations making the user experience wholesome
- Excellent data integration capabilities
- Good with complex data management tasks such as disk I/O optimization and index management
- Easily customizable as per the requirements of the user
Weaknesses:
- It is only available through the web
- Limited language support
- The pricing plan is non-transparent and hence, it is difficult to estimate cost
WEIGHTED CRITERIA ANALYSIS
- Modeling and Analytics: The tools must be the right combination of power and ease of use. Users must be able to model their business scenarios and analyze them effortlessly. Users must also be able to graphically slice and dice data from both relational and OLAP data sources and drill down to more details without any predefined limits. Also, strong reporting capabilities provide for deeper analysis of the data sets. This criterion carries the maximum weight as it’s the primary job of any BI tool and hence, a BI tool must incorporate a strong modeling and analytics capability.
- Interactive Visualization: This criteria is based upon the capability of a BI tool to portray the data models and analysis in a way that is easy to understand and visually palatable. The tool is should have interactive dashboards, scorecards and informative visualizations, which even a non-technical user can understand. This criterion has been given a lot of weight since there are several BI tolls with excellent reporting capabilities but analysis and understanding those reports and making the clients understand your study is an equally important task. Such capabilities form a liaison between the technical and business sides.
- Data Integration: It is extremely important for a tool with BI capabilities to be able to unify data from different sources. These sources include MySQL server, packaged applications such as SAP, PeopleSoft, Oracle, and Siebel and others. A single environment with one kind of data makes it easier to perform operations and maintain the system. This is a vital criterion because in today’s world, data is being collected from a large variety of sources and therefore, it needs to be synchronized for analysis and examination.
- Scalability: Scalability refers to the ability of our tool to ensure load balancing each time there is a failure or the ability of our tool to withstand load when more data and more users are added into the system. This in turn guarantees high availability for end users whenever they wish to access data. I have chosen scalability as one of my top five criteria because it is important for a system to handle itself during a breakdown, otherwise the breakdown might result in loss of information, delays and even loss of business.
- Cost Effectiveness: It is essential for a BI tool to be cost effective because for large enterprises it may cost a lot to perform data analysis or reporting. The cost of a BI tool is dependent on the following:
- The fact that it is open source or not
- Price for developer
- Server license
- Support fees/year
Although important, this factor has been provided with the least weight. This is because if the tool has outstanding functional abilities along with it being scalable and available, then even a high cost of the tool may be ignored.
CRITERIA
|
WEIGHT
|
TABLEAU
|
QLIK
|
TIBCO
|
PENTAHO
|
BIRST
|
Modeling and Analytics
|
30%
|
7
|
7
|
9
|
8
|
8
|
Interactive Visualization
|
25%
|
10
|
8
|
7
|
5
|
7
|
Data Integration
|
20%
|
10
|
9
|
7
|
8
|
8
|
Scalability
|
15%
|
8
|
6
|
7
|
7
|
6
|
Cost effectiveness
|
10%
|
8
|
7
|
4
|
9
|
9
|
Points
|
100%
|
8.6
|
7.3
|
7.5
|
7.2
|
7.4
|
Rank
|
1
|
4
|
2
|
5
|
3
|
As per the criteria I chose, I rank Tableau as first and Pentaho as last from among the BI tools selected. Tableau, with its interactive visualizations makes it easier for non-technical users to analyze the complex data sets that are fed into the system. Hence, it facilitates better decision-making. Also, its data integration capabilities from disparate sources are by far one of the nost efficient. In today’s world, with data sources all around us, it is essential for a BI tool to be able to capture this data, and synchronize it so that it can be read and analyzed.
Tabelau is followed by Tibco, which in turn is closely followed by Birst. While Tibco has excellent data modeling ability, Birst outperforms Tibco in the data integration area. Both of these tools face scalability issues. Birst further outdoes Qlik in the cost arena. This is because Birst is an open-source tool and hence, it’s available to the masses. Tibco’s cost concerns are being addresses by the organization, which is trying to develop new cost strategies. Both the tools have been ranked the same with regard to their interactive visualization capacity. Birst has been fairly placed in the “Challengers” quadrant because it has all the features to succeed. It only needs to work on its presence on a global level along with designing a few marketing strategies.
At 4th place we have Qlik, with its outstanding data integration and visualization abilities. Although Qlik has some amazing reporting and dashboarding capabilities, scalability is a major concern with the tool. The tool is unable to process large sets of complex data or manage a large number of users within an organization. Qlik has above average data modeling capacity. Though, Pentaho ranks last, it is only 0.1 points behind Qlik. The tool is cost-effective, has brilliant data integration and modeling capabilities. But the tool needs to make serious improvisations on its user interface, which needs to be friendlier to non-technical users. All in all, I feel that it has been rightly placed near the intersection of all four quadrants. With it being a new product, it definitely challenges the leaders with its modeling ability and is a visionary in the sense that it offers a range of functionalities and is continuously improving.
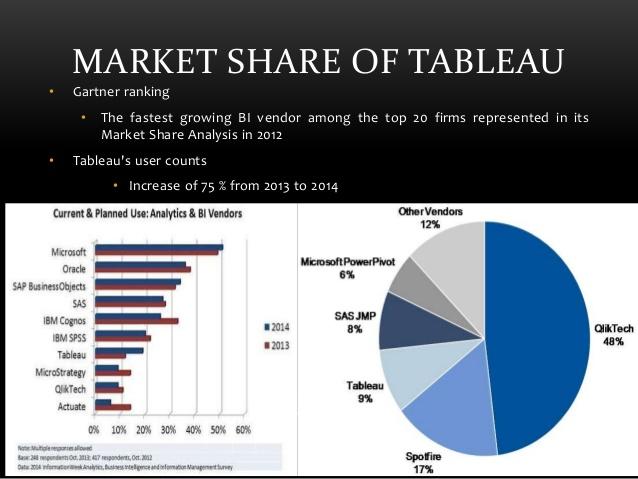
In conclusion, I would like to share a piece of information about Tableau, which happens to be my No. 1 tool. Tableau is one of the fastest growing Business Intelligence tools. The image below describes the market share of Tableau in 2012.
References:
No comments:
Post a Comment